


Transportation Mobility & Connectivity
Transportation Mobility & Connectivity
Transportation Mobility & Connectivity
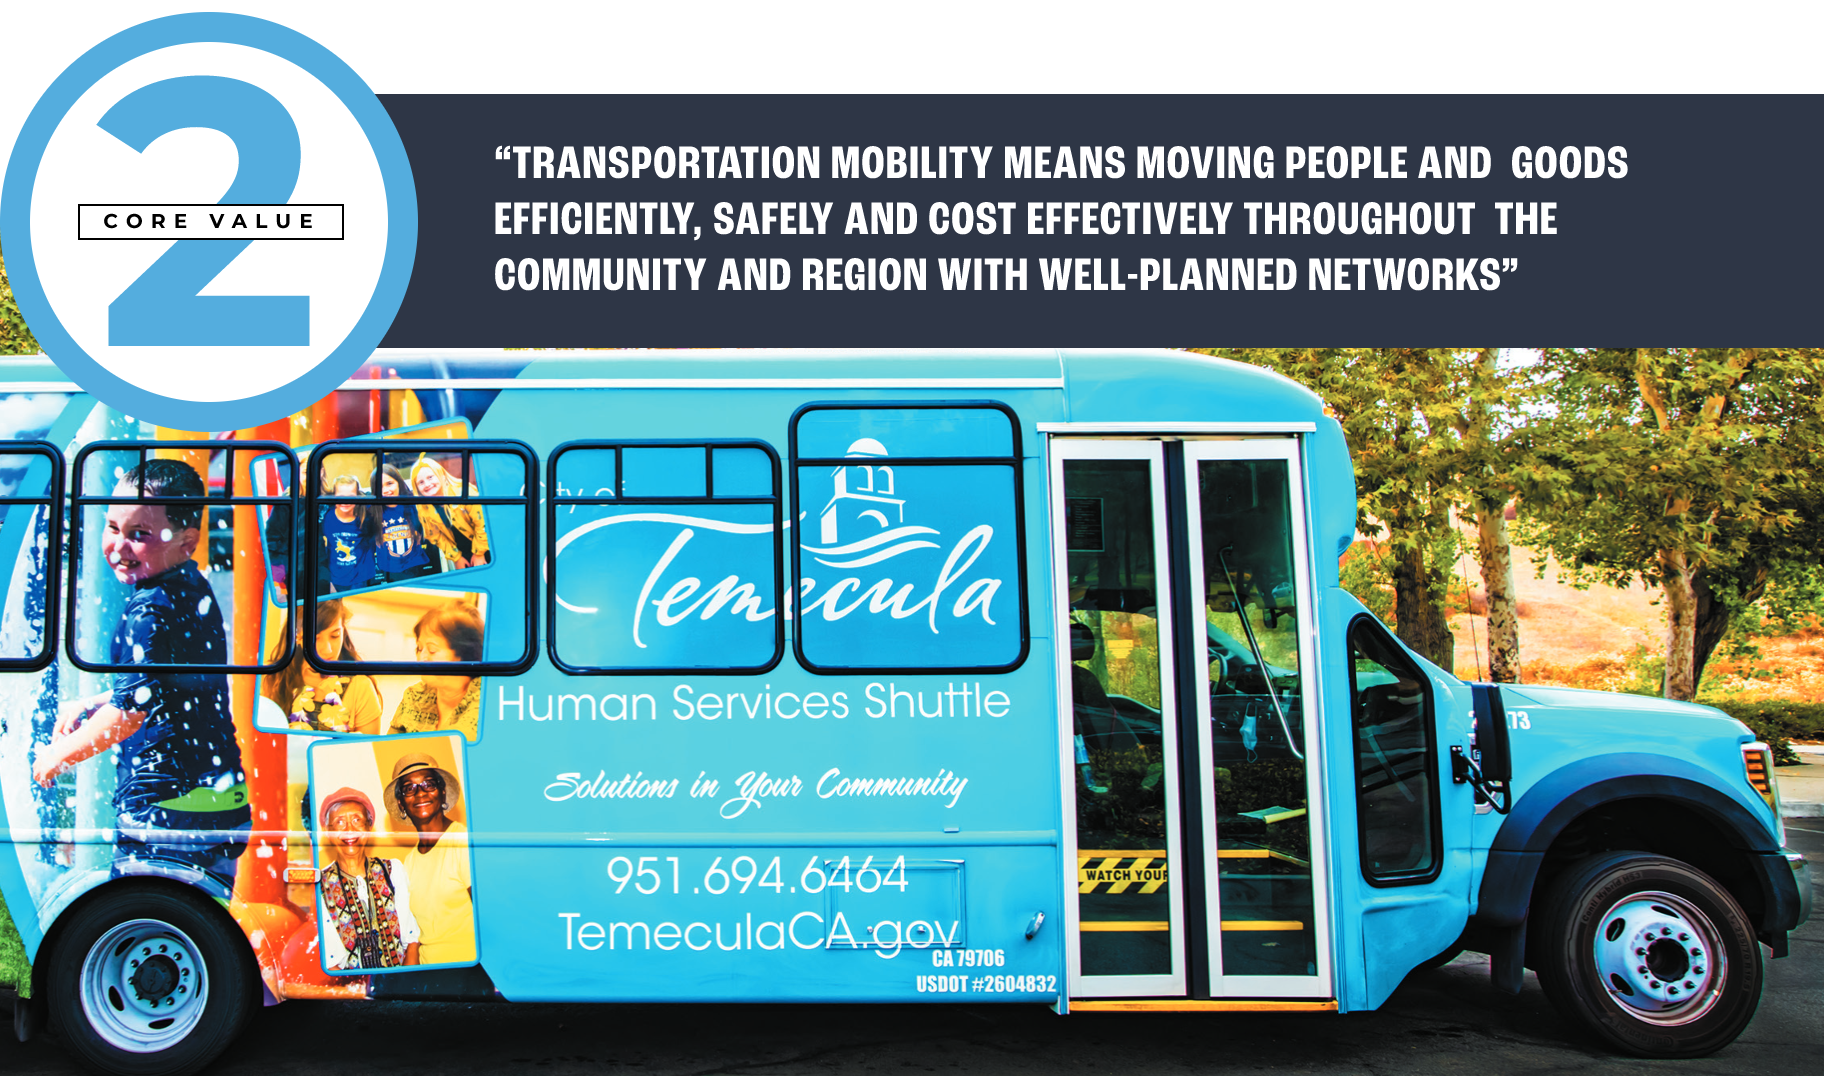
Transportation mobility & connectivity means providing all residents with access to good jobs, housing choices and neighborhoods, quality schools and medical facilities, shopping, restaurants, recreation and the goods and services that make a city desirable and livable.
Western Riverside County and the City of Temecula have grown rapidly over the past twenty years with high levels of population growth projected to continue. While local and regional policies emphasize development of more quality jobs within the City and region for Temecula’s residents, many must commute to jobs elsewhere, including San Diego County. These factors lead to long commutes, traffic congestion, air pollution, and strains on work/life balance. Congestion and travel delay add up to significant costs in lost productivity for businesses and increased costs for both households and employers. Temecula is located at a major regional crossroads in Southern California, and much of the traffic through the City is not locally generated. The City must collaborate with regional partners, including both Riverside County and San Diego County to address regional traffic patterns and mitigations.
In the True North Survey, residents expressed a strong desire to reduce traffic. In the upcoming General Plan Update, the City will adopt a new Circulation Element, which will provide an opportunity to identify ways to better manage traffic throughout the City. In 2022, the City engaged in the development of a Local Road Safety Plan (LRSP) which is identifying high accident locations for both auto travel and bicycles/ pedestrians. The City is studying further ways to integrate technology into the local transportation system to improve traffic flow and provide a foundation for the potential transition to autonomous vehicles and other new forms of mobility. Encouragement of micro mobility options, e-bikes, and scooters, in addition to further implementation of the Bikeways and Trails Master Plan, will help reduce vehicle trips in some areas of town. As stated by members of the Blue Ribbon Committee, “Let’s move people, not cars.” Options to improve transit connections as well as creating new options such as light rail travel may be explored.
Measuring Our Progress
| Indicator | Meets/Exceeds Goals | Progressing | Needs Improvement |
|---|---|---|---|
| Goal: Ensure that 75% of City’s lane miles meet or exceed PCI (Pavement Condition Index) of 70 | 70% meet standards |
| Indicator | Meets/Exceeds Goals | Progressing | Needs Improvement |
|---|---|---|---|
| Goal: Ensure 85% of intersections along the roadway network defined by the Circulation Element of the General Plan operate at Level of Service “D” or better | Yes | ||
| Goal: Ensure 90% of the road segments along the roadway network defined by the Circulation Element of the General Plan operate at Level of Service “D” or better | Yes |
| Indicator | Meets/Exceeds Goals | Progressing | Needs Improvement |
|---|---|---|---|
| Goal: Complete 80 miles of Bike Lanes | 74 miles or 92.5% completed | ||
| Goal: Complete 60 miles of Multipurpose trails | 48 miles or 80% completed | ||
| Goal: Maintain a “Very Walkable” rating for Old Town; 70-89 is a rating of “Very Walkable” based on Walk Score | Rating: 78 | ||
| Goal: Maintain a “Walkable” rating for Citywide average; 50-69 is a rating of “Walkable” based on Walk Score; less than 50 is very car dependent | Rating: 29 | ||
| Goal: A Gold Level Bicycle-Friendly Community; “Needs Improvement” is bronze; “Progressing” is silver; “Meets/ Exceed Goals” is gold | Bronze | ||
| Goal: Higher People for Bikes City Rating; “Needs Improvement” is 0-30; “Progressing” is 31-60; “Meets/Exceeds Goals” is 61-80 | 28 |
| Indicator | Meets/Exceeds Goals | Progressing | Needs Improvement |
|---|---|---|---|
| Goal: Increase transit ridership by 5% | 11.4% increase | ||
| Goal: Increase inter-regional transit ridership by 5% | 3.6% increase |
Our Accomplishments, Strategic Objectives, and Goals for 2040
- Temecula Parkway Interchange
- French Valley Parkway Improvements, Phase 1
- Established Asset Management Fund for a variety of capital expenditures
- Adopted Local Road Safety Plan
- Updated the Multi-use Trails and Bikeways Master Plan
- Completed a Sidewalk Gap Study
- Freeway Landscape Beautification & I-15 Gateway Monuments
- Auxiliary lanes both directions on I-15
- French Valley Parkway Phases 2 and 3 Improvements to I-15: 2 add’l NB and SB lanes and overpass at Date Street
- Initiate regional transportation discussions with Riverside and San Diego Counties for all transportation improvement options
- Tourism Transit Line linking Old Town, Wine Country and Pechanga, plus Park & Rides
- Additional Parking Structures in Old Town
- Improve Shade Structures at Bus Stops
- Increase park and ride facilities
- Median Enhancement and Street Revitalization
- Overland Bridge extension over Murrieta Creek
- Ynez Road widening north of Santiago Road
- Nicolas Road extension from Calle Girasol to Butterfield Stage Road
- Roundabout at Jedediah Smith & De Portola Road
- Implement Neighborhood Electric Vehicle (NEV) System
- Support walkable and transitoriented neighborhoods with accessible commercial services
- Maintain and improve our roadway network so that the flow of traffic is efficient
- Promote job growth in Temecula and nearby areas to reduce commuting
- Market the opportunities to work and shop locally to residents
- Expand and enhance the transportation network by completing missing links with appropriately sized streets
- Establish a connected pedestrian, bicycle and equestrian transportation system consistent with the Multi-use Trails and Bikeways Master Plan
- Coordinate land use and transportation to create a balanced, modern and integrated transportation system
- Increase transportation and mobility options
- Develop a Complete Streets Policy document
- Additional public Electric Vehicle (EV) charging stations
Community Survey
The survey acts as the City’s report card from the community. The purpose of the study is to assess perceptions of quality of life in the City and identify important issues and services. The survey gathers opinions on topics and has the residents rate the topics by level of priority (high priority vs. lower priority). It also evaluates perceptions of local government and customer services by rating the expectation level (exceeds expectations vs. not satisfied).
Exceeds Expectations or is a High Priority (>85%)
Progressing or is a Medium Priority (70-84%)
Not Satisfied or is a Lower Priority (<70%)
Local Streets and Roads Maintenance
94.1%
Resident importance to maintain local streets and roads
70.7%
Resident satisfaction with maintenance of local streets and roads
Traffic Congestion
60.1%
Resident satisfaction with efforts to improve traffic circulation by improving roads, intersections, signal timing and other measures
80.7%
Resident importance of coordinating traffic signals
71.4%
Resident satisfaction with coordinating traffic signals
94.6%
Resident satisfaction with emergency paramedic services
Bike Trails, Pathways, Walkability
94.1%
Resident importance to maintain local streets and roads
70.7%
Resident satisfaction with maintenance of local streets and roads
Transit
45.8%
Resident importance of providing local public transportation and shuttle services
73.2%
Resident satisfaction with local public transportation and shuttle services
Rating of Resident Spending Priorities (medium and high priorities)
93.2%
Make infrastructure improvements to improve traffic circulation
91.7%
Advocate to State, Federal Depts of Transportation to improve traffic circulation on I-15
62.9%
Expand and improve the network of bicycling, pedestrian, recreational trails
34.3%
Build additional park-n-ride lots for carpoolers
The city and regional agencies are making continual investment in transportation infrastructure. Many of the projects take multiple years to come to fruition, and competition for scarce financial resources will be a challenge.